April 21, 2021
Since I lamented about the black-box nature of performance engineering in SwiftUI two days ago, I spent some time familiarizing myself with the SwiftUI tools inside of Instruments. While I’ve made some headway, I’ve also hit a wall.
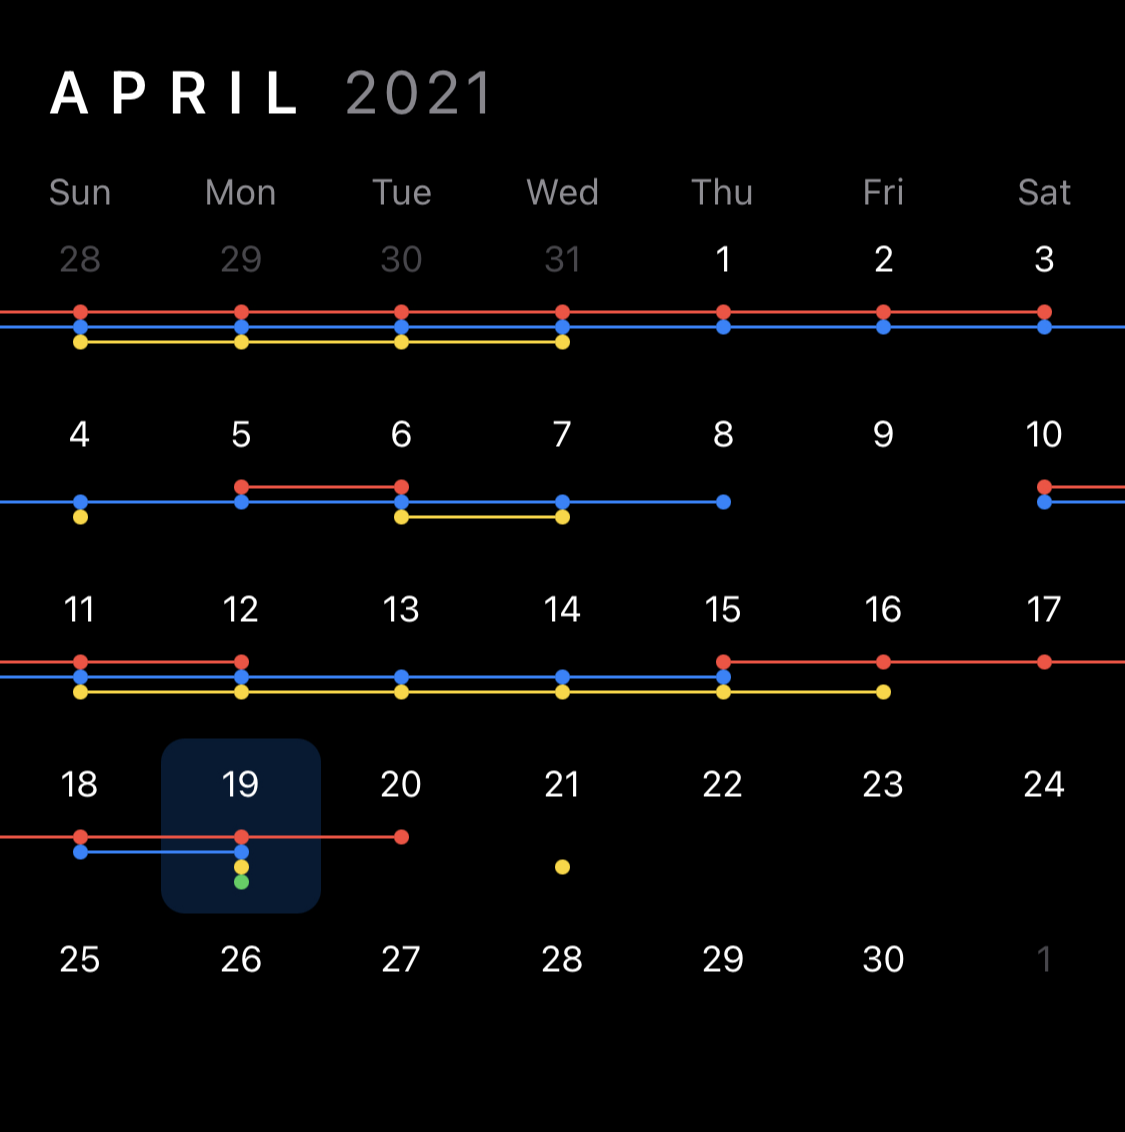
First, some context. As I mentioned earlier, Captain’s Log is a simple habit-tracking app that I want to use as a playground for experimenting with streaks, streak freezes, and the psychology of motivation. It’s currently a document-based app that stores its data in a plain text file. Right now there are only two screens. The main screen shows a day’s status on each habit and a calendar to help visualize how each streak is going. Then, there’s a second screen to tweak any additional details for completing a habit. (For example, to prepare for exiting quarantine, I’m trying to ride my bike at least a little every day. When I record a bike ride in Captain’s Log, I track how long and how far I ride.)
While performance isn’t terrible, there are noticeable lags in several interactions. For the past two evenings, I wanted to eliminate one of the lags: There is a noticeable delay processing keystrokes in the edit form, with the first keystroke being the worst.
Here’s what I learned after a few days poking around with the SwiftUI tools in Instruments.
- My pre-SwiftUI Instruments workflow of just looking at heaviest stack frame in Time Profiler and optimizing that doesn’t work in this case. The heaviest stacks are all deep in SwiftUI library code that I don’t understand.
- When debugging UI glitches, the Core Animation tool is really helpful. All of the places where I noticed that the UI was lagging, like typing characters, were visible in the Core Animation track as “long transaction commits.” For instance, before any performance optimizing, there’d be a 135ms core animation commit when processing the first keystroke in my edit form. Having these sections called out in the track let me focus specifically on what was happening at this problematic times.
- Paul Hudson pointed out that you can use the Hide System Libraries option in Time Profiler to quickly find bottlenecks in your code instead of the SwiftUI code. This helped! I found a couple of places where I was doing excessive calendar math when drawing the streak visualization view. However, unnecessary calendar math was only about 25% of the CPU use during the long transaction commits – the rest is SwiftUI library code. With my optimizations I got the long commit down to 100ms. Better, but still way too long for processing a keystroke.
- The SwiftUI View Body tool showed that my view bodies aren’t that heavy. Most compute in 2-4 microseconds. In the span of a 100ms core animation commit, I spend 0.6ms computing view bodies for my own views and a total of 2ms computing all view bodies. 98% of the time is spent somewhere else.
- But here’s what I don’t understand. The SwiftUI View Properties tool shows that my main
FileDocumentstruct changes on each keystroke. And I assume because theFileDocumentchanges, SwiftUI recomputes everything that depends on that document (basically, all the UI in the app). On every keystroke. I don’t understand this at all. Inspecting my code, it doesn’t look like the file document should be changing on each keystroke (the text fields are backed by a separateStringbinding independent of theFileDocumentuntil you tap Done). I wrote some customBindingcode and set breakpoints everywhere I could think to validate that the document is not changing on each keystroke. In spite of that, SwiftUI is convinced that it needs to recompute everything that depends on this document every time I enter a new character in a text field.
I don’t know how to debug this further. This is exactly what I meant when I wrote earlier about the inherent tension between declarative UI frameworks and performance tuning. I’ve described what I want in my UI (“a monthly calendar with line segments showing how long I’ve maintained different streaks”). There are probably things I can do to make that “what” even more efficient. However, code I don’t understand and has don’t have access to has decided the “how” of making my app work involves recomputing that calendar on each keystroke. I don’t know how I can make the app responsive without having the ability to influence that “how.”
Since Captain’s Log is a toy app meant for me to learn, I’m just going to leave things as is and hope that Apple provides better performance guidance and tools at WWDC 2021.
